- Elements
Zinc
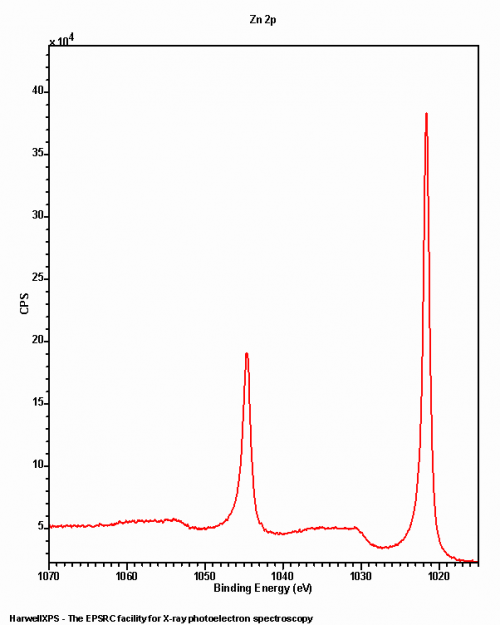
Zinc analysis is typically performed on the Zn 2p photoemission, however obtaining the Zn KLL auger region is often paramount for interpreting the data correctly. There may be a slight overlap between the Zn 2p peaks and the O and V KLL augers from Al X-rays, however it should not impede deconvolution, partly due to the large doublet separation (23 eV).
Common binding energies for Zinc species may be found below:
| Species | Binding energy / eV | Charge Ref. | Ref. |
| Zn | 1021.65 | Au 4f / 83.95 eV | 1 |
| ZnO | 1021.7 | C 1s / 285 eV | 2 |
While the separation above may be small, as mentioned previously, the Zn LMM auger may assist in spectral understanding via the modified Auger parameters (table 2).

- Data acquired by HarwellXPS
- Ramgir, N. S., et al. (2006). “ZnO multipods, submicron wires, and spherical structures and their unique field emission behavior.” The Journal of Physical Chemistry B 110(37): 18236-18242. Read it online here.
- Diler, E., et al. (2014). “Initial formation of corrosion products on pure zinc and MgZn2 examinated by XPS.” Corrosion science 79: 83-88. Read it online here.
Created: May 28, 2024