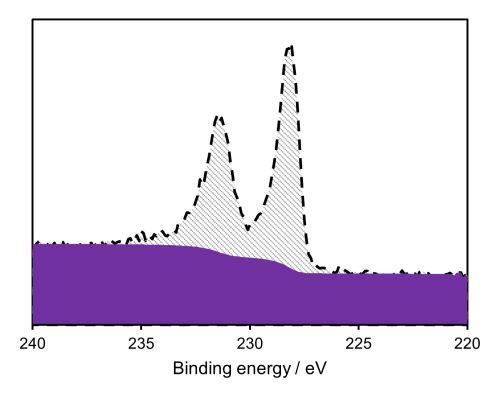
Figure 1: Mo metal XPS spectra(1)
As can be seen in figure 1, the peaks of Mo metal are asymmetric in shape, however the oxides will possess a symmetric shape.
Typical binding energies for common Mo species may be found in table 1.
| Species | Binding energy / eV | Charge Ref | Ref |
| Mo | 227.8 | Au 4f / 84 eV | 2 |
| MoO2 | 228.7 | Au 4f / 84 eV | 2 |
| MoO3 | 232.8 | Au 4f / 84 eV | 2 |
Table 1: Common binding energies of Mo species
References
- Spectra recorded by HarwellXPS
- Werfel, F. and E. Minni (1983). “Photoemission study of the electronic structure of Mo and Mo oxides.” Journal of Physics C: Solid State Physics 16(31): 6091. Read it online here.