- Elements
Phosphorus
XPS analysis of phosphorous is typically performed on the P 2p region which may overlap with Sr 3d peaks or with the Zn 3s peak if the phosphorous has a high oxidation state. The doublet separation of P 2p is 0.86 eV.
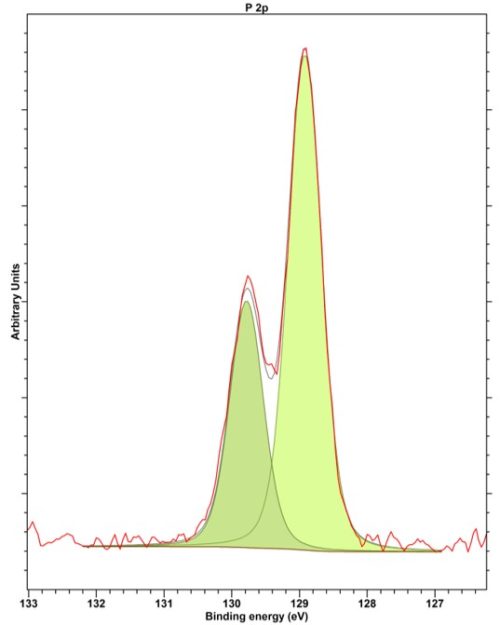
Figure 1: High resolution P 2p XP spectra from GaP showing the 0.86 eV splitting(1)
There exists a relatively sizable energy separation between phosphorous states of varying oxidation, permitting relatively trivial deconvolution. Table 1 presents a range of binding energies for common phosphorous species.
References
- Data acquired by HarwellXPS
- Edmonds, M. T., et al. (2015). “Creating a stable oxide at the surface of black phosphorus.” ACS applied materials & interfaces 7(27): 14557-14562. Read it online here.
- Wang, Y. and P. M. Sherwood (2002). “Phosphorus pentoxide (P2O5) by XPS.” Surface Science Spectra 9(1): 159-165. Read it online here.
- Liu, K., et al. (2004). “Surface analysis of (NH2) 2CS‐treated GaP (001) by AES and XPS.” Surface and Interface Analysis: An International Journal devoted to the development and application of techniques for the analysis of surfaces, interfaces and thin films 36(8): 966-968. Read it online here.
Created: April 27, 2024