- Elements
Argon
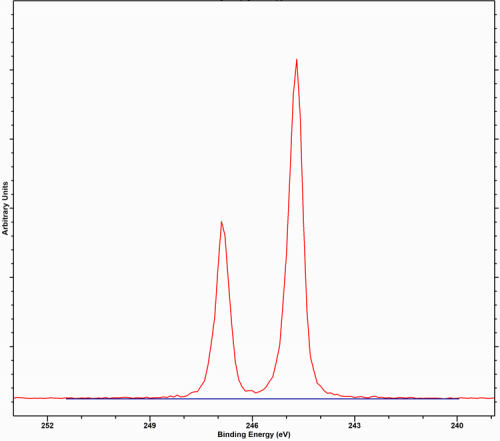
Argon, commonly encountered as an ion from ion etching experimetns, such as depth profiles, is only typically seen implanted after sputter cleaning or depth profilesalthough the gas-phase spectra as seen in figure 1, have been recorded at near ambient pressures (NAP-XPS) [1].
Implanted argon is more likely to be detected when higher energy beams are used or ion sputtering It is more likely to be detected when using higher energy beams as this leads to implantation. The use of lower beam energies, typically allows the argon to escapes through defects and the damage caused in the crystal structure.
| Species | Ar 2p3/2 Binding Energy / eV | Reference |
|---|---|---|
| Ar (gas) | 244.7 eV | 1 |
| Ar (Implanted Graphite) | 241.9 eV, 241.7 eV | 2, 3 |
| Ar (Implanted in Pt(111)) | 240.4 eV | HarwellXPS |
| Ar (Impanted in Rh(111)) | 241.1 eV* | HarwellXPS |
*Argon in Rh is seen to exhibit secondary structure, possibly due to the different atomic positions taken by the Argon atoms. Argon has a spin-orbit splitting of 2.2 eV, with an intensity ratio of 0.49 eV as measured in our fit of the gas phase spectrum in [1]; Thermo Scientific report the ratio to be 0.512.
If a sample hasn’t been sputtered, then the presence of argon should be confirmed by the presence of the Ar 2s peak at ca. 319 eV. Implanted argon may have apparent different binding energies, depending upon the nature of the matrix material and is likely to caused by a a difference in work function of the material as opposed to a chemical shift.
References
(1) Patel et al., Argon gas, by near-ambient pressure XPS, Surface Science Spectra 26, 014024 (2019); Read it online here
(2) J.F. Moulder, W.F. Stickle, P.E. Sobol, K.D. Bomben, Handbook of X-ray Photoelectron Spectroscopy, Perkin-Elmer Corp, Eden Prairie, MN, 1992.
(3) B.Vincent Christ, Argon Implanted into Graphite, by XPS, Surface Science Spectra 1, 376 (1992); Read it online here