HarwellXPS Guru
  • Home
  • Blog
  • User Login
    • New users
    • Lost password
  • HarwellXPS

Knowledge Base

  1. Home
  2. Knowledge Base
  3. HarwellXPS Beginners Course
  4. 026: XPS for Beginners – Fundamentals 6

026: XPS for Beginners – Fundamentals 6

  • Created April 21, 2021
  • Author Mark Isaacs
  • Category HarwellXPS Beginners Course

QUIZ TIME!

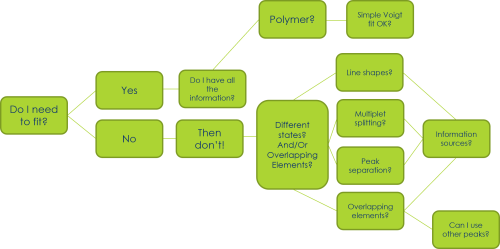
Let’s play ‘To fit or not to fit!’

The rules of the game are simple, we give you a spectrum (or multiple spectra) and some background behind what information the researcher wanted and you decide whether or not we need to deconvolute/fit the data or if we can learn all we need from the raw spectra itself. Note – none of these examples are of or even based on real research or researchers.

ROUND ONE

This researcher synthesised some novel titania based nanomaterials. XPS was performed to determine that the final material was TiO2 and not a mixture of titania and various suboxides.

Don’t Fit!

We can obtain all of the information we need just from looking at the line profile of this spectrum. Ti 4+ produces a simple doublet which can be described in terms of:

Area(1/2)  = Area(3/2) x 0.5

FWHM(1/2) = FWHM(3/2) x 

Position(1/2) = Position(3/2) + 5.7 eV (Binding energy)

If you need a reminder of where these come from, check out our article on spin-orbit splitting

Note: Ti is one of a few rare cases where FWHM (1/2) =/= FWHM (3/2). To learn why, read our article on Coster-Kronig transitions.


ROUND TWO

In example 2, we see some Ag 3d peaks, which appear to report 2 chemical environments. The researcher identified the lower binding energy signal as Ag metal but was not sure of the identity of the second species.

Fit!

In this case, we will need to know a bit more about the data in order to confirm the identity of the peak. Knowledge of the peak position can be obtained through simple analysis of the raw data, though for a more precise determination, spectral envelopes will help in compensating for the background and the metal peak.

Furthermore, quantification of the peak areas will allow us to compare the atomic % of the unknown silver species with the other elements and chemical entities discovered in the data analysis and help determine a likely  identity.


ROUND THREE

A researcher is looking into some platinum nanoparticles and uses XPS to determine if the resulting particles are metallic. All they want is a yes or no answer, but upon collected the data, they note that the Pt 4f 7/2 and 5/2 are roughly the same intensity.

Fit!

While the researcher only wants a yes or no answer – it is hard to say if there is one or two species here without deconvolution, since we must account for the background. The fact that the doublet is roughly the same intensity would suggest that there is a competing emission within the high binding energy peak and, indeed, if you do deconvolute the spectra you will find that underneath the Pt 4f 5/2 peak of the metal there is infact a Pt 4f 7/2 oxidic peak!


ROUND FOUR

Analysis of a spent catalyst was performed to look for evidence of carbonate formation. The research question is simple, could carbonate formation cause catalyst deactivation?

Don’t Fit!

With no requirements for quantitative assessment, the mere presence of a clear and obvious carbonate peak (~290 eV) may answer the research question. While fitting this spectra would prove trivial, there are no competing emissions in the region and the carbonate signal provides all the detail we need.

ROUND FIVE

XPS was used to determine the level of corrosion of some treated steels. The researcher is very new to XPS and is interested in the oxidation state of the surface.

Don’t Fit!

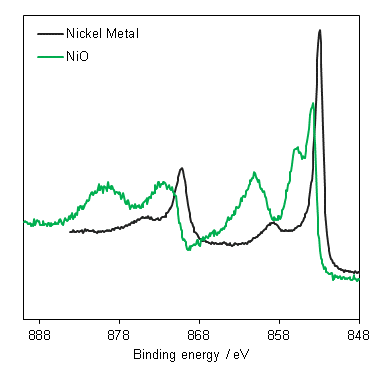
We covered ultiplet spitting in an earlier session and it really does make fitting first row TMs tricky! It’s of course possible to develop peak models based on theory or standards and deconvolute or perform linear combination fitting – but given this user is brand new to XPS, they might be advised to begin by simple using qualitative techniques to describe the data by comparing it with well known literature standards. In the case of iron, the position of the small satellite feature between the major photoemissions gives insight into the specific oxidation state.

Was this article helpful?

Yes No

Related Articles

  • Protected: 031: Instrumentation – XPS
    • 0
    • 167
  • 027: XPS for Beginners – Data Analysis 7
    • 1
    • 173
  • 046: XPS for Beginners – Data Analysis 6
    • 1
    • 157
  • 044: XPS for Beginners – Data Analysis 4
    • 0
    • 160
  • 043: XPS for Beginners – Data Analysis 3
    • 1
    • 168
  • 042: XPS for Beginners – Data Analysis 2
    • 0
    • 173

Leave A Comment? Cancel Reply

User Login

Log In
Register Lost Password

Forums

  • General Discussion Forum
  • XPS Analysis Software

Post Categories

  • General
  • Knowledge
  • Review
  • Uncategorized

Forum Statistics

Registered Users
38
Forums
6
Topics
7
Replies
5
Topic Tags
5

HarwellXPS Guru

(c) 2020 HarwellXPS

Follow Us

Copyright HelpGuru. Powered by HeroThemes.