- Elements
Nickel
Nickel, as with most first row TMs, is not straightforward to analyse by XPS. The 2p region is the most commonly analysed, however it undergoes extensive multiplet splitting upon the formation of a compound (Figure 1), rendering chemical state analysis a daunting task. The only realistic photoemission which may overlap with Ni 2p is the La 3d peak, although the extent of overlap is minimal. Auger structure from Fe LMM, Ce LMM and F KLL have been known to cause issues (can be severe depending on relative amounts of Ni:X, X = Fe, Ce, F) with Ni 2p deconvolution when using Al (1486.7 eV) X-rays.
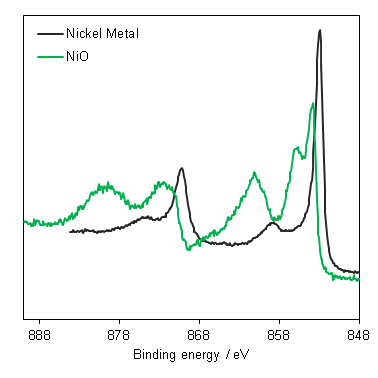
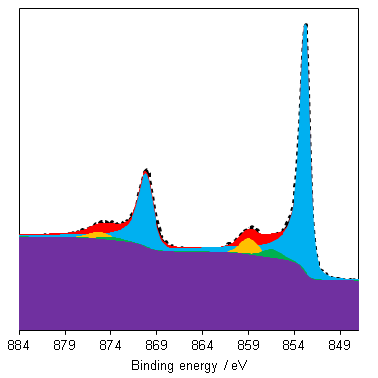
Nickel metal is not particularly unusual, it consists of the prominent asymmetric 2p emission, a small satellite peak at +6 eV, which following REELS analysis has been attributed to a surface plasmon loss feature rather than a shake-up peak, a feature at +9.5 eV, attributed to a bulk plasmon loss feature and a significant spin-orbit separation of 17.3 eV (Figure 2).(2) Care should be taken when peak fitting since, as is the case with most first row transition metals, the FWHM of the 2p 1/2 is larger than that of the 3/2 (~ x1.667) due the peak broadening caused by a Coster-Kronig transition.(3)
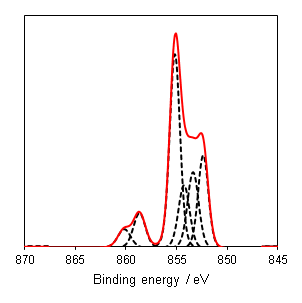
NiO has a complicated spectra (Figure 3), however, which can not be represented by a purely Ni2+ envelope (Figure 4). The three major peaks shift in energy and width, while a large broad peak at 861 eV appears, likely arising from the combined losses at +4.3 eV, +6.0 and +7.4 eV due to intra-and inter-band transitions allowed by breakdown of dipole selection rules in polycrystalline samples with delocalized electrons.(2) The peaks at the high energy end are shake-up satellites from ligand-metal charge transfer. It is thought that the reason that NiO cannot be fit using a free ion envelope (whereas Ni(OH)2 and NiOOH can both be fit using the free ion envelopes of Ni2+ and Ni3+, again with an additional broad peak due to other intrinsic losses) may be due to a short Ni-O bond length in the rock salt Fm-3m structure with a high degree of orbital overlap leading to dominant inter-atomic angular momentum interactions with nearest neighbouring NiO6 clusters and charge transfer from the O 2p band.(4)
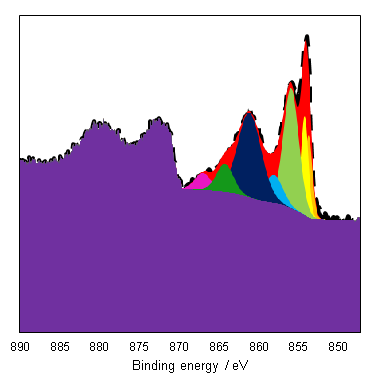
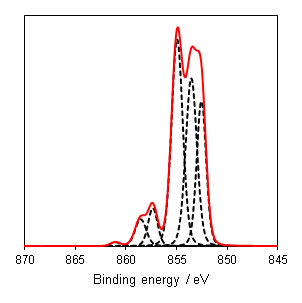
As a general rule it is known that Ni(III) species exist at higher energies than than of Ni(II) species,(6) and this can be seen from the Gupta and Sen multiplet(5) envelopes in Figure 4, where the contribution at lower energy is diminished for Ni(III) free ions. This facilitates a qualitative analysis of Ni 2p regions for the most part which is frequently misinterpreted as a quantitative assessment (using simplistic or even singular GL or Voigt functions) in literature. Quantitative assessment requires an appreciation of the multiplet splitting envelopes as a minimum and deconvolution is entirely possible with some knowledge of the system, using some of the methods derived by Biesinger et al.(7) In the case of unknown mixtures, it may be useful to use spectral subtraction or difference spectra to identify mixed phases. These methods have even extended to mixed oxide systems such as nickel chromates.(8)
Auger parameters may be useful in the analysis of nickel chemical state (with the exception of metallic alloys). Mark Biesinger has extensively studied and modeled nickel compounds(4) and determined there is a significant effect to the Ni L3M45M45 auger upon changing the ligand caused primarily by changes to electronegativity (initial state effects). The auger parameters determined by Biesinger et al may be of use in Ni XPS analysis (Table 1).
| Compound | Ni 2p 3/2 / eV | Auger parameter (α‘) / eV |
| Ni | 852.54 | 1698.76 |
| NiO | 853.78 | 1697.71 |
| Ni(OH)2 | 855.80 | 1698.38 |
| γ-NiOOH | 855.75 | 1700.04 |
| NiF2 | 858.12 | 1697.86 |
| NiCl2 | 856.77 | 1698.65 |
| NiBr2 | 855.27 | 1698.52 |
| NiI2 | 854.46 | 1699.69 |
In recent years, non-linear least squared fits have been utilized to approach the deconvolution and quantification of unknown samples, however this approach relies heavily on obtaining good quality standard reference spectra, as well as the assumption that the unknown spectra is free from additional charge-transfer, relaxation or other inter-atomic effects.(9)
References
- Spectra recorded by HarwellXPS
- Grosvenor, A. P., et al. (2006). “New interpretations of XPS spectra of nickel metal and oxides.” Surface science 600(9): 1771-1779. Read it online here.
- Konishi, T., et al. (1999). “Chemical shift and lineshape of high‐resolution Ni Kα x‐ray fluorescence spectra.” X‐Ray Spectrometry: An International Journal 28(6): 470-477. Read it online here.
- Grosvenor, A. P., et al. (2016). Biesinger, M. C., et al. (2012). “The role of the Auger parameter in XPS studies of nickel metal, halides and oxides.” Physical Chemistry Chemical Physics 14(7): 2434-2442. Read it online here.
- Gupta, R. and S. Sen (1975). “Calculation of multiplet structure of core p-vacancy levels. II.” Physical Review B 12(1): 15. Read it online here.
- Carley, A., et al. (1999). “The formation and characterisation of Ni3+—an X-ray photoelectron spectroscopic investigation of potassium-doped Ni (110)–O.” Surface science 440(3): L868-L874. Read it online here.
- Biesinger, M. C., et al. (2009). “X‐ray photoelectron spectroscopic chemical state quantification of mixed nickel metal, oxide and hydroxide systems.” Surface and Interface Analysis: An International Journal devoted to the development and application of techniques for the analysis of surfaces, interfaces and thin films 41(4): 324-332. Read it online here.
- Biesinger, M. C., et al. (2011). “Resolving surface chemical states in XPS analysis of first row transition metals, oxides and hydroxides: Cr, Mn, Fe, Co and Ni.” Applied Surface Science 257(7): 2717-2730. Read it online here.
- Fu, Z., et al. (2018). “Quantitative analysis of Ni2+/Ni3+ in Li [NixMnyCoz] O2 cathode materials: Non-linear least-squares fitting of XPS spectra.” Applied Surface Science 441: 1048-1056. Read it online here.