HarwellXPS Guru
  • Home
  • Blog
  • User Login
    • New users
    • Lost password
  • HarwellXPS

Knowledge Base

  1. Home
  2. Knowledge Base
  3. Elements
  4. Molybdenum

Molybdenum

  • Created July 22, 2020
  • Author Mark Isaacs
  • Category Elements

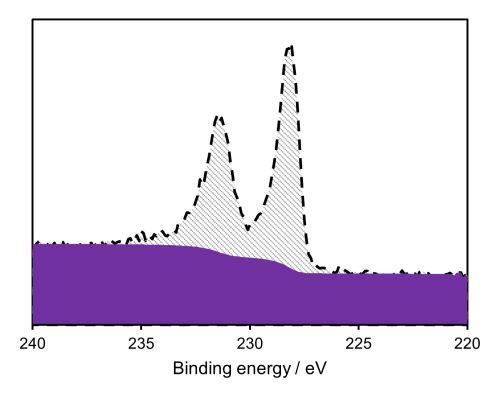
Molybdenum XPS analysis is typically performed on the 3d region (Figure 1). This region commonly overlaps with the S 2s region, which may complicate the deconvolution of molybdenum sulfates. Additional regions which may overlap with the Mo 3d region include Ta 4d, Cs 4s, Se 3s and Ce 4p (only slightly, but record an extended region to the low binding energy side to aid deconvolution). The peaks have a reasonable doublet separation of 3.15 eV.

Figure 1: Mo metal XPS spectra(1)

As can be seen in figure 1, the peaks of Mo metal are asymmetric in shape, however the oxides will possess a symmetric shape.

Typical binding energies for common Mo species may be found in table 1.

SpeciesBinding energy / eVCharge RefRef
Mo227.8Au 4f / 84 eV2
MoO2228.7Au 4f / 84 eV2
MoO3232.8Au 4f / 84 eV2
Table 1: Common binding energies of Mo species

References

  1. Spectra recorded by HarwellXPS
  2. Werfel, F. and E. Minni (1983). “Photoemission study of the electronic structure of Mo and Mo oxides.” Journal of Physics C: Solid State Physics 16(31): 6091. Read it online here.

Was this article helpful?

Yes No

Related Articles

  • Tellurium
    • 0
    • 196
  • Iron
    • 2
    • 265
  • Arsenic
    • 0
    • 263
  • Phosphorous
    • 0
    • 269
  • Silicon
    • 0
    • 264
  • Carbon
    • 2
    • 439

Leave A Comment? Cancel Reply

User Login

Log In
Register Lost Password

Forums

  • General Discussion Forum
  • XPS Analysis Software

Post Categories

  • General
  • Knowledge
  • Review
  • Uncategorized

Forum Statistics

Registered Users
38
Forums
6
Topics
7
Replies
5
Topic Tags
5

HarwellXPS Guru

(c) 2020 HarwellXPS

Follow Us

Copyright HelpGuru. Powered by HeroThemes.