- Elements
Vanadium
Analysis of Vanadium by XPS is typically performed on the V 2p region, which overlaps very slightly with the O 1s region, slightly complicating analysis (Figure 1), though provided an extended region is acquired, collecting both V 2p peaks and the O 1s region then background application and peak fitting may be fairly trivial. The doublet separation varies with chemical state, and is around 7.5 eV
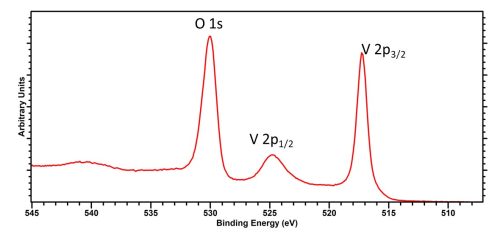
As with most first row TMs, the 2p1/2 peak exhibits a larger FWHM than that of the 2p3/2 due to Coster-Kronig processes.
Some common binding energies may be found in table 1.
| Species | Binding energy / eV | Charge Ref | Ref |
| V metal | 512.7 | Cu 2p / 932.3 eV | 2 |
| V2O3 | 515.15 | O 1s / 530 eV | 3 |
| VO2 | 515.65 | O 1s / 530 eV | 3 |
| V2O5 | 517 | O 1s / 529.8 eV | 3 |
| V6O13 | 516.5 | O 1s / 530 eV | 3 |
| V3O5 | 515.5 | C 1s / 285 eV | 4 |
| V4O7 | 516 | C 1s / 285 eV | 4 |
- References
- Spectra recorded by HarwellXPS
- Kasperkiewicz, J., et al. (1983). “XPS studies of vanadium and vanadium oxides.” Journal of Electron Spectroscopy and Related Phenomena 32(2): 123-132. Read it online here.
- Mendialdua, J., et al. (1995). “XPS studies of V2O5, V6O13, VO2 and V2O3.” Journal of Electron Spectroscopy and Related Phenomena 71(3): 249-261. Read it online here.
- Demeter, M., et al. (2000). “Mixed-valence vanadium oxides studied by XPS.” Surface science 454: 41-44. Read it online here.
Created: June 1, 2020