Copper
- Elements
Doublet Separations
- Cu 2p: 19.8 eV
- Cu 3p: 2.4 eV
The Energies Listed are Binding Energies!
Cu 2p: 933 eV
Cu 2s: 1096 eV
Cu 3s: 120 eV
Cu 3p: 74 eV
The Energies Listed are Binding Energies!
Overlaps for Cu 2p (primary emission)
- Cs MNN (Al kα X-rays) (927 eV)
- I 3p (931 eV)
- Pr 3d 5/2 (932 eV)
- Bi 4s (939 eV)
- Sb 3s (944 eV)
- Mnn LMM (Al kα X-rays) (947 eV)
- Pr 3d 3/2 (953 eV)
Overlaps for Cu 3s
- Pr 4d (114 eV)
- Nd 4d (118 eV)
- Al 2s (119 eV)
- Pm 4d (121 eV)
- In 4s (122 eV)
- Ge 3p (122 eV)
- I 4p (123 eV)
Energies listed are Kinetic Energies!
Cu LMM: ~ 569.6 eV
The Energies Listed are Binding Energies!
| Species | Binding energy / eV | Charge Ref | Ref |
Satellite peaks are often observed in the Cu 2p spectra due to the presence of unpaired electrons in the 3d orbitals. Copper has a partially filled 3d orbital, which makes it susceptible to multiplet splitting. The presence of unpaired electrons in the 3d orbital leads to complex interactions within the electron cloud surrounding the copper atom.
Cu metal and Cu2O have a closed 3d shell, and hence exhibit little or no multiplet splitting/final-state effects. CuO on the other hand, has an open d shell (3d9) and is prone to these.
CuO exhibits a significant satellite around 9 eV above the major photoemission core line, characteristic of 3d9 states. The structure seen in the satellite line is
due to the multiplet splitting in the 2p53d9 final state. Explanations of the satellite in CuO (and the lack of it in Cu2O) have been developed using a cluster model in which the d-shell of CuO (being unfilled) accept charge transfer from neighbouring oxygen bands to screen the core-hole created via photoemission (creating a 3d10L) configuration (note that L. refers to a core-hole in the ligand) This results in the well defined satellite structure seen in CuO. The d-shell of Cu2O is full so screening via a charge transfer into the d states is not possible. The screening of the core hole must then be accomplished by states involving the broad sp conduction band and will, therefore, not yield sharp satellite structures.(9)
When analysing copper it is imperative that you record the Cu LMM auger as well as the Cu 2p region. This is because the difference between Cu0 and CuI XPS spectra is very slight, and correct speciation identification may prove impossible without the auger region to assist (Figure 1).

Figure 1: Cu, Cu2O and CuO 2p and LMM auger XPS(1)
Due to the difficulties mentioned above, it is therefore common to use the modified auger parameter (α‘) to assign chemistry, values for which may be found in table 1. To find auger parameters of many more compounds, see reference 5 from Mark Biesinger.
| Species | Modified auger parameter / eV | Ref |
| Cu | 1851.2 | 2 |
| Cu2O | 1849.4 | 3 |
| CuO | 1851.5 | 4 |
| Cu(OH)2 | 1853.1 | 5 |
| CuCl | 1847.8 | 5 |
| CuCl2 | 1850.2 | 5 |
| CuSO4 | 1851.4 | 5 |
The modified auger paramater may also provide insight into specific nanoparticle chemistry via estimation of the relaxation energy (r).(6) This may be defined as half the change in the modified auger parameter compared to bulk Cu (equation 1).(7)
r = 0.5 * (|1851.2 – α‘) Equation 1
Copper nanoparticles may evidence increased relaxation energies when an decreased number of copper atoms are screening the core-hole (i.e. smaller nanoparticles)(1) or due to a decrease in the polarizability of the support.(8)
Copper metal does not exhibit a high degree of asymmetry, due to it’s largely filled d-band. A lineshape of LA(1.05, 110) can be used to give a good fit for Cu metal.
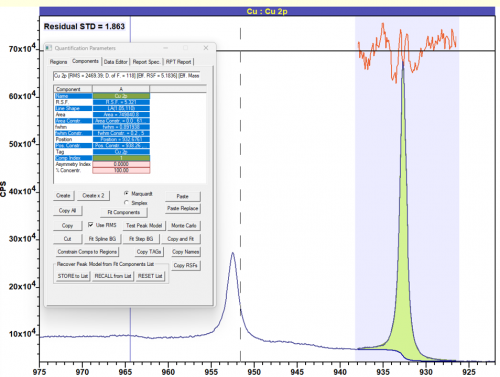
Figure 2: Cu metal fit with LA(1.05, 110) lineshape
When fitting copper doublets – do not constrain the FWHM of the doublets to be equal – due to the aforementioned Coster-Kronig broadening.
References
- Islam, M. J., et al. (2020). “The effect of metal precursor on copper phase dispersion and nanoparticle formation for the catalytic transformations of furfural.” Applied Catalysis B: Environmental: 119062. Read it online here.
- Miller, A. and G. Simmons (1993). “Copper by XPS.” Surface Science Spectra 2(1): 55-60. Read it online here.
- Vasquez, R. (1998). “Cu2O by XPS.” Surface Science Spectra 5(4): 257-261. Read it online here.
- Vasquez, R. (1998). “CuO by XPS.” Surface Science Spectra 5(4): 262-266. Read it online here.
- Biesinger, M. C. (2017). “Advanced analysis of copper X‐ray photoelectron spectra.” Surface and interface analysis 49(13): 1325-1334. Read it online here.
- Thøgersen, A., et al. (2008). “An experimental study of charge distribution in crystalline and amorphous Si nanoclusters in thin silica films.” Journal of Applied Physics 103(2): 024308. Read it online here.
- Moretti, G. (1998). “Auger parameter and Wagner plot in the characterization of chemical states by X-ray photoelectron spectroscopy: a review.” Journal of Electron Spectroscopy and Related Phenomena 95(2-3): 95-144. Read it online here.
- Batista, J., et al. (2001). “On the structural characteristics of γ-alumina-supported Pd–Cu bimetallic catalysts.” Applied Catalysis A: General 217(1-2): 55-68. Read it online here.
- Ghijsen, Jacques, et al. “Electronic structure of Cu 2 O and CuO.” Physical Review B 38.16 (1988): 11322. Read it online here.