- Elements
Carbon
Carbon analysis by XPS is typically recorded for every experiment, due to the common presence of adventitious carbon contaminant layers. Analysis is performed on the C 1s region, which may overlap with K 2p (only higher BE species) and Ru 3d.
Since carbon peaks are of S-orbitals analysis is often relatively trivial, with large energy separations between carbons of differing functional groups (figure 1)
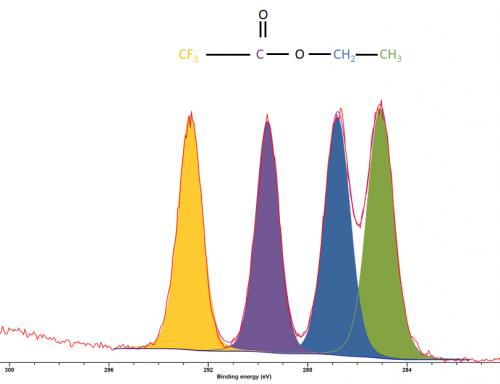 Figure 1: XPS spectrum of ethyl trifluoroacetate
Carbon binding energies follow the typical trend of an increasing binding energy with a increase of the electronegativity of the nearest neighbouring atoms (figure 2).

Binding energies and references may be found in table form below:
| Species | Binding energy / eV | Charge Ref. | Ref. |
| sp3 C | 285 | C 1s = 285 eV | 1 |
| sp2 C (graphitic/graphene) | 283.6 | Au 4f / 83.95 eV | 2 |
| C=C | 284.2 | C 1s = 285 eV | 3 |
| C – C(=O)R | 285.5 ± 0.3 | C 1s = 285 eV | 1 |
| C-OH | 286.5 ± 0.2 | C 1s = 285 eV | 1 |
| C-O-C | 286.5 ± 0.1 | C 1s = 285 eV | 1 |
| C-N | 285.9 ± 0.1 | C 1s = 285 eV | 3 |
| Epoxide | 287 | C 1s = 285 eV | 1 |
| C=O | 287.8 ± 0.2 | C 1s = 285 eV | 1 |
| C – C(O)=O | 286.8 ± 0.2 | C 1s = 285 eV | 1 |
| O-C=O | 289 ± 0.2 | C 1s = 285 eV | 1 |
| C-F2 | 292.6 | C 1s / 285 eV | 4 |
| Metal-C | ~282 | C 1s / 284.6 eV | 5 |
| Si-C | 283 | C 1s / 284.6 eV | 6 |
Graphene, graphite, graphene oxide and reduced graphene oxide
Novel 2D carbon materials are incredibly powerful technologies for a number of applications and as such require chemical analysis, often by XPS.
The choice of energy calibration for pure carbon samples is not an easy one, though peak shape is an early indicator of graphitic carbon vs other forms since graphitic carbon possesses an asymmetric peak shape with a lower FWHM than that of hydrocarbons or similar.
Aligning the major carbon peak to a typical binding energy once you have determined the character allows facile addition of additional components.
Further evidence for sp3 vs sp2 graphitic character may be obtained from the C KLL auger, specifically the differentiated spectra. Following differentiation, evaluation of the energy separation between the minima and maxima permits determination of a so-called ‘d-parameter’ which may be used to assess the carbon local environment (figure 3).

Graphitic carbon nitrides
Graphitic carbon nitrides (g-C3N4) is a unique family of materials commonly found in photocatalytic applications. The deconvolution of this structure is similar in many ways to pure graphitic carbon, but with some specific additional peaks. It may be difficult to energy calibrate such spectra to the lowest binding energy peak, since the majority of the spectra will be dominated by C-N-C peaks, so calibrating to this peak at 288.1 eV (figure 4).(7)

Polymers
Historically, XPS has found great use in the polymer community and as such a large database of polymer XPS can be found in the works of Beamson and Briggs especially.(1)
Inorganics (carbonates)
Carbonates are found at high binding energies (~289.5 ± 0.6 eV), with the exception being that of silver carbonate which may be found ~288.5 eV.
References
- Briggs, D. and G. Beamson (1992). “Primary and secondary oxygen-induced C1s binding energy shifts in x-ray photoelectron spectroscopy of polymers.” Analytical Chemistry 64(15): 1729-1736. Read it online here.
- Geng, D., et al. (2011). “Nitrogen doping effects on the structure of graphene.” Applied Surface Science 257(21): 9193-9198. Read it online here.
- Ederer, J., et al. (2017). “Determination of amino groups on functionalized graphene oxide for polyurethane nanomaterials: XPS quantitation vs. functional speciation.” RSC advances 7(21): 12464-12473. Read it online here.
- Santerre, F., et al. (1999). “Properties of TiC thin films grown by pulsed laser deposition.” Applied Surface Science 148(1-2): 24-33. Read it online here.
- Shimoda, K., et al. (2007). “Influence of surface structure of SiC nano-sized powder analyzed by X-ray photoelectron spectroscopy on basic powder characteristics.” Applied Surface Science 253(24): 9450-9456. Read it online here.
- Beamson, G., et al. (1996). “Characterization of PTFE on silicon wafer tribological transfer films by XPS, imaging XPS and AFM.” Surface and Interface Analysis: An International Journal devoted to the development and application of techniques for the analysis of surfaces, interfaces and thin films 24(3): 204-210. Read it online here.
- Qiao, S., et al. (2016). “Pore confinement effects and stabilization of carbon nitride oligomers in macroporous silica for photocatalytic hydrogen production.” Carbon 106: 320-329. Read it online here.